Short answer: Real workshop productivity is measured with three indicators: billable hours as a percentage of available hours per technician, efficiency by work type, and comeback rate for rework. These metrics can only be calculated if the system records actual start and end times for each technician on every work order.
Most shop managers know how many work orders they closed in the month. Some know how much the shop billed. Few can say what the real productivity was per technician, what the efficiency rate was on available hours, or which service types generated positive margin and which didn’t.
The difference between those two levels of information isn’t just academic. A shop that closed 80 work orders but with low technician efficiency and negative margins on a third of the jobs is not a productive shop — it’s a busy one. Real productivity requires measuring the right things, not just what’s easy to count.
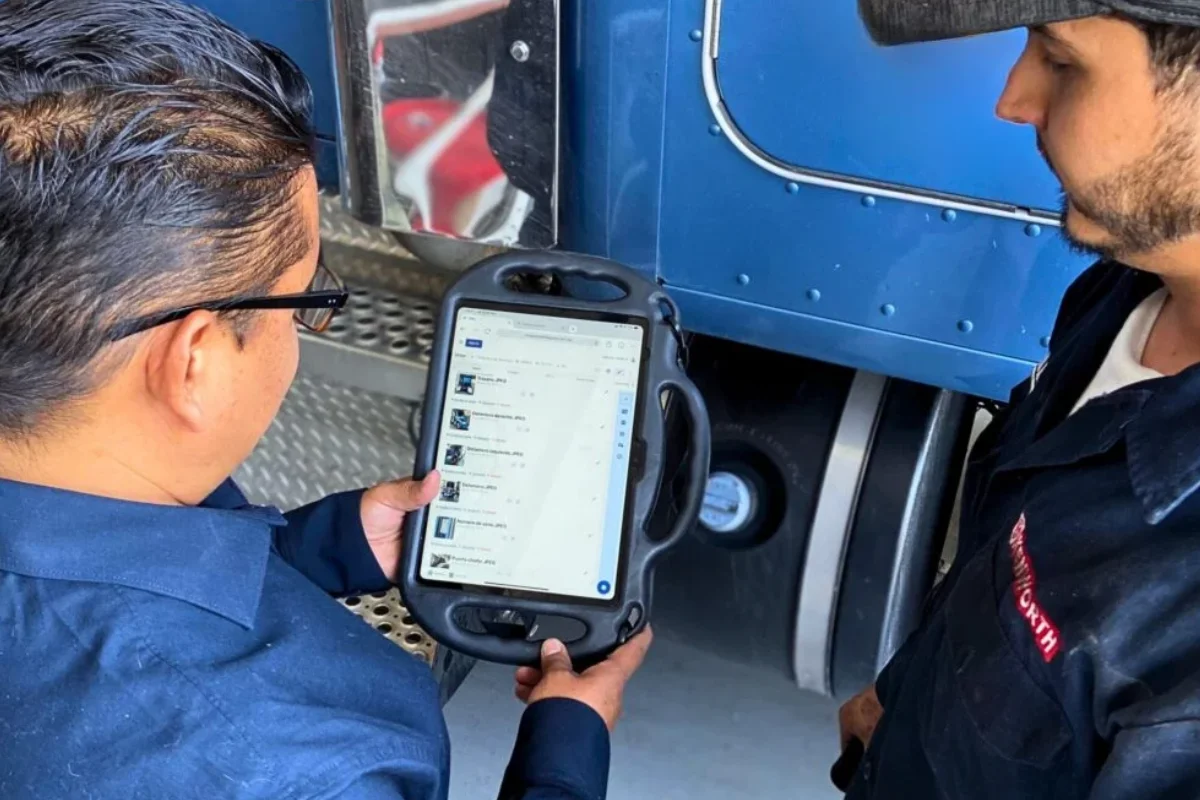
The Metrics That Actually Matter
Billable Hours vs. Available Hours
This is the most revealing metric of workshop productivity. Every technician has a set number of available hours per week. Of those hours, how many are being converted into billable work?
The gap between available and billable hours is time lost to non-productive activities: waiting for diagnosis, waiting for parts, administrative tasks, idle time between work orders. If a technician has 40 available hours in a week and only 25 are billed, there are 15 hours of capacity being lost every week.
To calculate this metric, the system needs to record each technician’s actual time on each work order — not the estimated time, but the real time with start and end recorded.
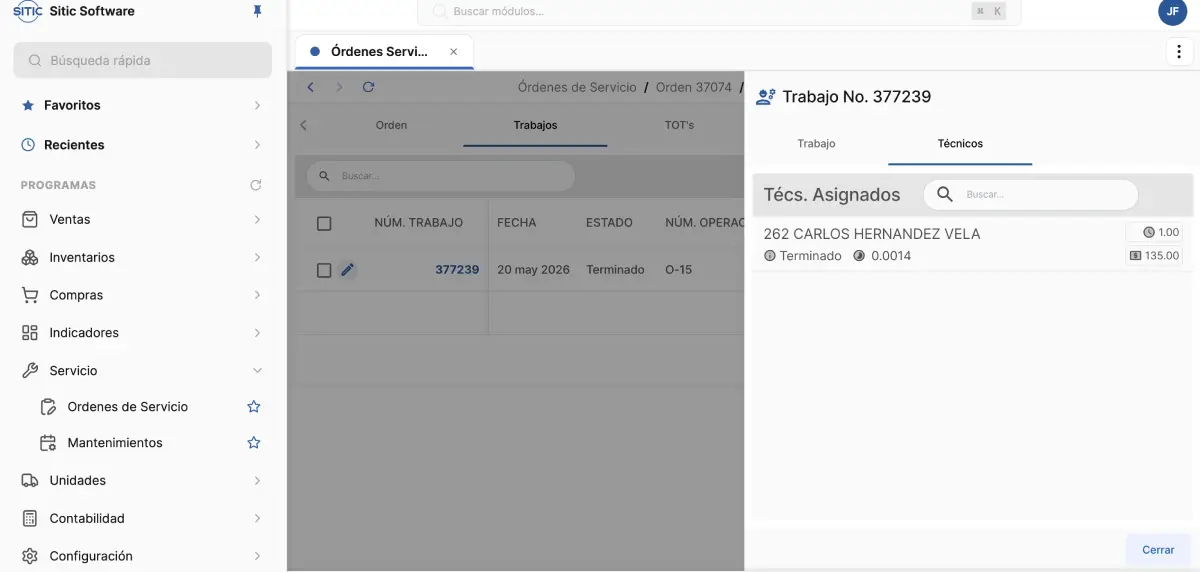
Efficiency by Technician
Not all technicians are equally efficient at all types of work. Some are faster at diagnostics, others more efficient on high-complexity mechanical jobs, others very good at high-volume preventive maintenance services.
When the system records actual time by technician and by work type, those patterns become visible. That data has real management value: assigning the right type of work to the right technician reduces cycle time and improves margin.
First-Visit Resolution Rate
How often does a unit come back to the shop for the same problem within 30 days of service? That metric — the comeback rate — is a direct indicator of work quality.
A shop with a high comeback rate has two problems: it loses time on rework that it either doesn’t bill or bills at reduced cost under warranty, and it erodes customer trust. Monitoring this metric lets you identify whether specific technicians or work types have abnormal return rates.
Why These Metrics Are Hard to Get Without a System
The obstacle to measuring these metrics in most shops isn’t lack of interest — it’s that the necessary data isn’t captured systematically. If the technician doesn’t record their start and end time on each order, billable hours can’t be calculated accurately. If return orders aren’t linked to the original order, the comeback rate can’t be calculated.
Getting these metrics without a system requires doing the work manually: reviewing orders one by one, cross-referencing dates, calculating times. That work can be done once as a diagnostic, but it can’t be done continuously. And productivity that isn’t measured continuously isn’t managed — it’s assumed.
How to Use Metrics to Improve
Productivity metrics have management value only if they’re used to make decisions:
If the billable hours rate is low: the problem might be in work order assignment, wait times for parts, or diagnostic time. Each cause has a different solution.
If certain technicians consistently show low efficiency: it may indicate a training need, poor use of strengths, or assignment of jobs for which they lack the equipment or experience.
If the comeback rate is high on certain work types: it may indicate a quality issue in that specific process, or incorrect diagnoses leading to incomplete repairs.
The metric shows where the problem is. Root cause analysis and improvement actions are management’s responsibility.
If you want to see how SITIC automatically generates workshop productivity metrics, schedule a demo with our team.